





Semiconductors power everything from smartphones to massive artificial intelligence (AI) servers. Choosing between high-growth memory leaders and diversified wireless giants like Micron Technology (IN -2.52%) and QUALCOMM (QCOM -2.64%) is a pivotal decision for investors today.
Micron Technology focuses on the memory and storage components essential for modern computing. Qualcomm provides the processors and modems that connect the world. Comparing these semiconductor leaders helps clarify where the next wave of growth might originate as we look toward 2027.
IN & QCOM: Performance Comparison
Key Financial Metrics
IN – Micron Technology
$778.31
–2.52% (–$20.13)

QCOM – Qualcomm
$172.47
–2.64% (–$4.67)
Market Cap
$881B
52wk Range
$192.59 – $1,255.00
Gross Margin
80.71%
P/E Ratio
10.49
EPS (TTM)
$74.21
Dividend & Yield
$0.57 (0.07%)
Market Cap
$185B
52wk Range
$121.99 – $259.92
Gross Margin
53.10%
P/E Ratio
13.58
EPS (TTM)
$12.70
Dividend & Yield
$3.62 (2.10%)

IN – Micron Technology
$778.31
–2.52% (–$20.13)
Market Cap
$881B
52wk Range
$192.59 – $1,255.00
Gross Margin
80.71%
P/E Ratio
10.49
EPS (TTM)
$74.21
Dividend & Yield
$0.57 (0.07%)
QCOM – Qualcomm
$172.47
–2.64% (–$4.67)
Market Cap
$185B
52wk Range
$121.99 – $259.92
Gross Margin
53.10%
P/E Ratio
13.58
EPS (TTM)
$12.70
Dividend & Yield
$3.62 (2.10%)
The case for Micron Technology
Micron Technology specializes in memory and storage solutions, primarily manufacturing DRAM and NAND chips for smartphones and artificial intelligence servers. The company now generates approximately 60% of its revenue from the data center market. Because its top ten customers account for over half of its total revenue, customer concentration like this adds a layer of risk to the business.
In the 12 months ended Sept. 3, 2026, revenue reached nearly $133 billion. This represents a significant revenue growth of approximately 256% compared to the prior year. The company reported a net income of roughly $85 billion during this period, driven by high demand for high-bandwidth memory products.
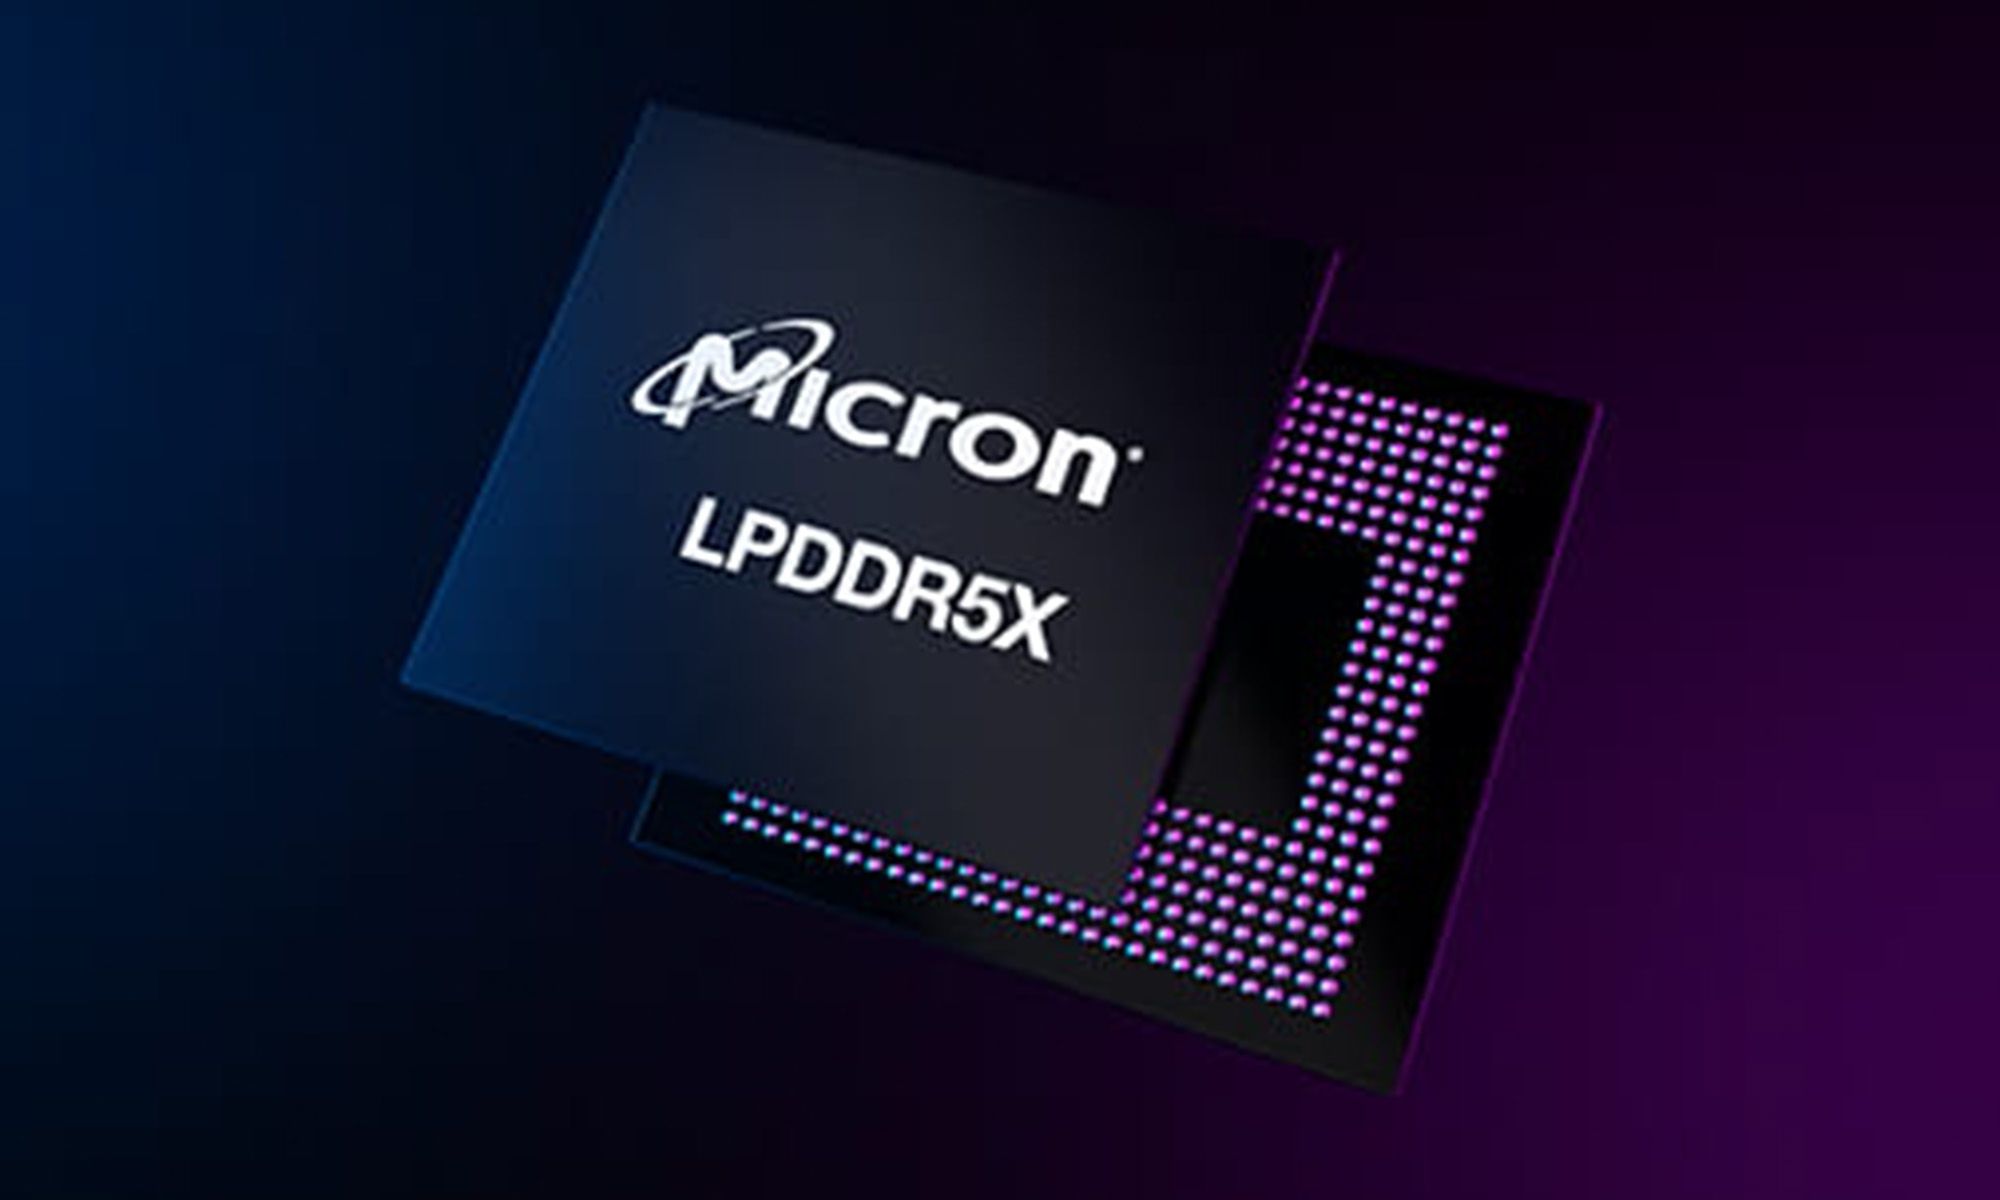
Image source: Micron.
As of its September 2026 balance sheet, the debt-to-equity ratio is 0x. This ratio measures total debt, including both short- and long-term obligations, against shareholders’ equity, and a value of zero suggests the company has negligible debt. The current ratio of 3.3x indicates ample assets to cover short-term liabilities, and it generated nearly $59.0 billion in free cash flow in the fiscal year ended Sept. 3, 2026.
The case for Qualcomm
Qualcomm designs the modems and processors that power millions of mobile devices while diversifying into the automotive and Internet of Things markets. Apple and Samsung are major customers, with each representing 10% or more of total revenues. This reliance on large partners means Qualcomm remains a central player in the semiconductor industry.
In the 12 months ended Sept. 27, 2026, revenue reached nearly $43 billion. This was a slight decline, as revenue growth was approximately- 2.6% over the previous year. Despite the dip in sales, the company achieved a net income of roughly $13.6 billion, aided by its high-margin patent licensing business.
Image source: Getty Images.
As of its September 2026 balance sheet, the debt-to-equity ratio is approximately 0.5x, reflecting a moderate use of total debt relative to shareholder equity. The current ratio of 1.9x indicates it can comfortably cover short-term liabilities. In the fiscal year ended Sept. 27, 2026, free cash flow was nearly $8.7 billion.
Risk profile comparison
Micron Technology faces significant volatility in chip prices, leading to unpredictable revenue cycles. It deals with intense competition in the data center market and regulatory challenges stemming from restrictions imposed on its products by the Chinese government. The company must also manage the costs of massive expansion projects while competing against rivals like Samsung and SK Hynix.
Qualcomm faces high revenue concentration from mobile handset makers, who are increasingly seeking to develop their own internal modems. This shift toward vertical integration, especially by customers like Apple, could reduce future demand for its connectivity products. The company also faces substantial exposure to trade tensions in China and ongoing legal challenges regarding its patent licensing practices.
Valuation comparison
Investors must choose between the lower Forward P/E based on future earnings estimates and the lower P/S ratiowhich measures market value against sales over the past twelve months.
| Metric | Micron Technology | QUALCOMM |
|---|---|---|
| Forward P/E | 4.3x | 18.0x |
| P/S ratio | 6.6x | 4.3x |
Valuation metrics include those sourced from Financial Modeling Prep (FMP) and may differ from those of other data providers.
Which stock would I buy for 2027?
I would buy Qualcomm for a few reasons.
The company is expanding into the data center market, targeting $5 billion in revenue by fiscal 2027 and $15 billion in data center revenue by fiscal 2029. It is also seeing rapid growth in its automotive segment.
Moreover, Qualcomm is not dependent on growing investment in new data centers. It is aiming to gain share of existing spending. This makes it a potentially safer stock to ride the data center boom, especially given the prospect of additional guardrails on new data center construction following the midterm elections.
Micron is too sensitive to memory pricing for me to be comfortable holding the stock beyond 2027. It might continue to hit new highs over the next 12 months, but in the longer term, I think Qualcomm has a more durable business that can still deliver market-beating returns to shareholders in 2027 and through the end of the decade.
Where to invest $1,000 right now
When our analyst team has a stock tip, it can pay to listen. After all, Stock Advisor’s total average return is 823%* — a market-crushing outperformance compared to 209% for the S&P 500.
They just revealed what they believe are the 10 best stocks for investors to buy right now, available when you join Stock Advisor.
*Stock Advisor returns as of November 14, 2026.
Source: www.fool.com