




To analyze South Korea’s research landscape, the global status and trends of materials science research over the past decade (2015–2024) are presented in Fig. 1. The comprehensive research methodology is illustrated in Supplementary Fig. S1 in the Supplementary Information, and further described in the Methods section. Figure 1a illustrates the geographical distribution of cumulative materials science outputs, revealing a high concentration of output in North America, Europe, and Asia. In terms of research productivity, Fig. 1b ranks the top 15 nations by cumulative volume. South Korea ranks seventh globally with 232,100 documents and has achieved an 8.1% compound annual growth rate (CAGR) since 2015, marking the fourth highest rate worldwide (Supplementary Table S1). Alongside this quantitative growth, Fig. 1c displays the cumulative citation counts of the top 15 nations, reflecting research impact. South Korea ranks sixth globally with 6.0 million citations and has maintained a CAGR of 6.6% in citations since 2015, the fourth highest worldwide (Supplementary Table S2). Furthermore, Fig. 1d examines researcher density relative to population size. South Korea exhibits the highest global concentration of specialists, with 2.68 researchers per 1000 people (representing 138,550 researchers out of 52 million), positioning the nation at the forefront of research workforce density (Supplementary Table S3). Collectively, these data reveal that South Korea ranks seventh in productivity, sixth in impact, and first in research workforce density.
a Global choropleth map representing the cumulative volume of materials science documents by country as of 2024. b Temporal evolution of cumulative number of documents for the top 15 most productive nations. c Temporal evolution of cumulative citation counts for the top 15 countries, reflecting research impact. d Distribution of the proportion of materials science researchers against total population size for the top 15 leading countries in 2024.
To investigate the institutional contributors to these trends, South Korea’s research output was categorized by institutional sectors: universities, research institutes, and corporations, as shown in Fig. 2. Detailed lists of the specific institutions within each sector are provided in Supplementary Table S4. Supplementary Table S5 presents the status of the number of organizations in each sector from 2015 to 2024. Among the 301 identified institutions in 2024, universities constituted the largest share at 54.5% (164), while research institutes and corporations represented 26.9% (81) and 18.6% (56), respectively. Figure 2a presents the cumulative growth of document counts for each institutional sector, with the corresponding numerical data provided in Supplementary Table S6. As of 2024, the cumulative distribution of publications in materials science is dominated by universities, accounting for 78.6% (286,930 papers), followed by research institutes at 15.7% (57,320 papers), and corporations at 5.7% (20,830 papers). The CAGR for each sector, measured from 2015 to 2024, was recorded at 9.16% for universities, 8.48% for research institutes, and 6.06% for corporations.
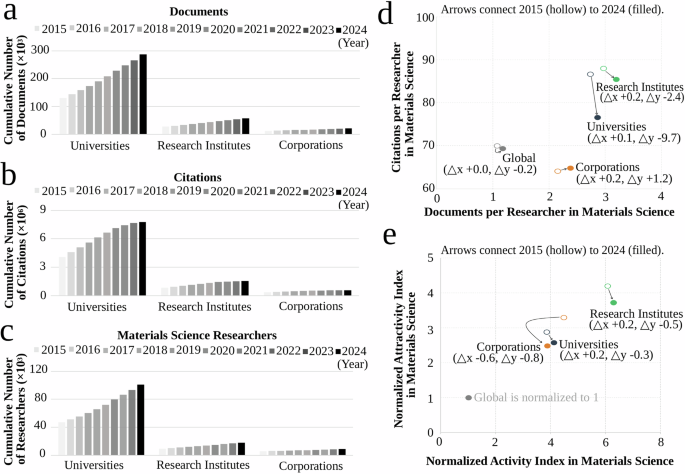
Cumulative growth of a document count, b citation count, and c the number of materials science researchers across three sectors: universities, research institutes, and corporations. d Changes in cumulative research productivity (documents per researcher) and impact (citations per researcher). e Evolution of the Normalized Activity Index (NAI) and Normalized Attractivity Index (NAAI) for each sector.
The CAGR for both universities and research institutes surpassed the global average of 8.04%, demonstrating competitive research productivity in these sectors. Similarly, Fig. 2b illustrates the cumulative growth of citation counts for each institutional sector, with the corresponding numerical data detailed in Supplementary Table S7. The cumulative distribution of citations as of 2024 is led by universities at 78.7% (7.78 million), followed by research institutes at 15.5% (1.53 million) and corporations at 5.8% (0.57 million). The CAGR for each sector, measured from 2015 to 2024, was 7.38% for universities, 7.22% for research institutes, and 5.03% for corporations. Corresponding to the publication trends, the citation growth rates for both universities and research institutes exceeded the global average of 6.25%, reflecting the observed citation trends of these sectors. Figure 2c and Supplementary Table S8 illustrate the cumulative growth in the number of materials scientists within each sector. Similarly, the cumulative distribution of materials scientists as of 2024 comprised universities at 79.1% (101,190 persons), followed by research institutes at 14.0% (17,959 persons) and corporations at 6.9% (8840 persons). The CAGR for each sector from 2015 to 2024 was recorded at 8.81% for universities, 7.55% for research institutes, and 4.99% for corporations. Notably, the growth rates for both universities and research institutes exceeded the global average of 6.29%, reflecting a sustained expansion of the research workforce in these sectors.
Figure 2d illustrates the comparative performance of each sector by mapping research productivity (cumulative documents per researcher) on the x-axis and research impact (cumulative citations per researcher) on the y-axis. This approach was used to summarize the per-researcher publication and citation metrics of South Korea’s materials science research across institutional sectors. The per-researcher productivity and impact in South Korea significantly exceeded global benchmarks (e.g., in 2015: 1.10 papers, 69.63 citations; 2024: 1.14 papers, 69.40 citations). Specifically, universities (2.75 to 2.84 papers; 86.55 to 76.89 citations) and research institutes (2.96 to 3.19 papers; 87.87 to 85.46 citations) maintained high levels of performance. Corporations also showed an upward trend in productivity, recording 2.36 papers per researcher in 2024 (up from 2.15 in 2015); however, their citation impact, though increasing from 63.78 to 64.02, remained below the global average (Supplementary Table S9). Figure 2e demonstrates the proportional weight and qualitative standing of materials science within each sector’s research portfolio. To quantify these trends, the Normalized Activity Index (NAI) and the Normalized Attractivity Index (NAAI) were employed50. The NAI measures the degree of research specialization in materials science for the specific institutional sector relative to the global average, and is defined as follows (Eq. 1):
$${\mathrm{NAI}}=\frac{{{\mathrm{AI}}}_{{\mathrm{Sector}}}}{{{\mathrm{AI}}}_{{\mathrm{World}}}}$$
(1)
where \({{\mathrm{AI}}}_{{\mathrm{Sector}}}\) denotes the Activity Index (AI) of a specific institutional sector and \({{\mathrm{AI}}}_{{\mathrm{World}}}\) represents the global average AI value. AI denotes the proportion of materials science publications within a sector’s total research output and is defined as follows (Eq. 2):
$${{\rm{AI}}}=\frac{{{\rm{Publications}}}\; {{\rm{in}}}\; {{\rm{the}}}\; {{\rm{given}}}\; {{\rm{field}}}\,\left({{\rm{Materials}}}\; {{\rm{Science}}}\right)\;{{\rm{by}}}\; {{\rm{the}}}\; {{\rm{selected}}}\; {{\rm{group}}}}{{{\rm{Total}}}\; {{\rm{publications}}}\; {{\rm{by}}}\; {{\rm{the}}}\; {{\rm{selected}}}\; {{\rm{group}}}}$$
(2)
Similarly, NAAI is utilized to assess the relative citation concentration (attractivity) of materials science within each sector’s research portfolio. NAAI is defined as the ratio of the specific sector’s Attractivity Index (AAI) to the global average AAI value (Eq. 3):
$${{\rm{NAAI}}}=\frac{{{{\rm{AAI}}}}_{{Sector}}}{{{{\rm{AAI}}}}_{{World}}}$$
(3)
where \({{\mathrm{AAI}}}_{{Sector}}\) denotes the AAI of a specific institutional sector and \({{{\rm{AAI}}}}_{{World}}\) represents the global average AAI value. AAI signifies the proportion of materials science citations relative to the sector’s total citations across all fields, defined as follows (Eq. 4):
$${\mathrm{AAI}}\!=\frac{{{\mathrm{Citations}}}\in {{\mathrm{the}}}\,{{\mathrm{given}}}\,{{\mathrm{field}}}\, ({{\mathrm{Materials}}}\,{{\mathrm{Science}}})\,{{\mathrm{by}}}\,{{\mathrm{the}}}\,{{\mathrm{selected}}}\,{{\mathrm{group}}}}{{{\mathrm{Total}}}\,{{\mathrm{citations}}}\,{{\mathrm{by}}}\,{{\mathrm{the}}}\,{{\mathrm{selected}}}\,{{\mathrm{group}}}}$$
(4)
For instance, with a global AI of 0.03 in materials science (representing 3% of the total publications) and a university-sector AI of 0.11 (11%), the resulting NAI is 3.87. This indicates that the relative research intensity in materials science within the university sector is 3.87 times higher than the global benchmark. Using this methodology to calculate NAI and NAAI values, the results for each sector are as follows: universities (NAI 3.87, NAAI 2.87 in 2015; NAI 4.07, NAAI 2.57 in 2024), research institutes (NAI 6.07, NAAI 4.21 in 2015; NAI 6.25, NAAI 3.72 in 2024), and corporations (NAI 4.50, NAAI 3.32 in 2015; NAI 3.93, NAAI 2.50 in 2024), as shown in Supplementary Table S10. Considering the cumulative changes over the past decade, South Korea’s research intensity and citation concentration in materials science are high compared with the global average. The research intensity (NAI) across all sectors—universities, research institutes, and corporations—remained at least 3.93 times the global mean, while the citation concentration (NAAI) was at least 2.5 times higher. Notably, research institutes recorded the highest values in 2024, with an NAI of 6.25 and an NAAI of 3.72.
Figure 3 provides a multifaceted assessment of each sector’s research excellence and thematic focus. This evaluation is based on a suite of bibliometric indicators, including the h-index, g-index, Institution-Field Quantitative and Qualitative Analysis (IFQ2A) index, Activity Index of Citation Classes (AICC), and keyword frequency analysis of the top 1% most-cited documents. Figure 3a presents the sectoral h-index, which is calculated by treating each institutional sector as a single collective entity. This metric adapts the original h-index51, which was initially designed to evaluate the scientific output of individual researchers. Conventionally, the h-index is defined as the number of papers (h) that have each received at least h citations, serving as a balanced measure of both productivity and impact. Over the ten-year period, the h-indices for universities and research institutes rose by 14.3% (491 to 561) and 19.6% (280 to 335), respectively. Meanwhile, the h-index for corporations increased by 9.5% (221 to 242). In 2024, the h-index intensity per 1% of personnel for research institutes (23.9) and corporations (35.1) was 3.4 to 5 times higher than that of universities (7.1). Despite representing only 14.0% and 6.9% of the workforce, respectively; these sectors demonstrate a far higher concentration of research excellence compared to universities (79.1%). Figure 3b presents the sectoral g-index, which is similarly calculated by treating each institutional sector as a single collective entity. As a complementary metric to the h-index, the g-index is employed to better account for the performance of highly cited papers within each sector. This metric also adapts the original g-index52, which was initially designed to evaluate the scientific output of individual researchers. The g-index is defined as the highest number g such that the top g most-cited papers have together received at least g2 citations. The g-indices for universities, research institutes, and corporations rose by 5.6% (860 to 908), 22.9% (441 to 542), and 15.0% (366 to 421), respectively, over the ten-year period. In 2024, the g-index intensity per 1% of personnel for research institutes (38.7) and corporations (61.0) was 3.4 to 5.3 times higher than that of universities (11.5). This variation is more distinct than that observed in the h-index, indicating a higher concentration of high-impact research within non-academic sectors, despite their small personnel shares of 14.0% and 6.9%. Figure 3c presents the sectoral IFQ2A index, a composite indicator designed for a holistic evaluation of both research volume and quality. This index is calculated by synthesizing multiple metrics: the total publications, total and average citations, proportion of papers in the top 10%, h-index, and the ratio of publications in Q1 (top 25%) journals53. The calculation details and specific values for the individual metrics comprising the sectoral IFQ2A index are presented in Tables S11–S14. During the period from 2015 to 2024, the sectoral IFQ2A-indices remained remarkably stable; with universities, research institutes, and corporations recording scores of 0.98, 0.28, and 0.13, respectively. However, an analysis of the IFQ2A intensity per 1% of personnel reveals values of 0.0124 for universities, 0.0200 for research institutes, and 0.0188 for corporations. Notably, the research contribution per capita for research institutes and corporations remains 1.5 to 1.6 times higher than that of universities. These results suggest that while universities provide a large quantitative foundation, research institutes and corporations show a higher per-capita concentration of high-impact publications relative to their personnel size. Additionally, to analyze how high-impact research (top n% cited papers) is distributed across different segments relative to the total publication volume of each institutional sector, we adopted the AICC as a cumulative indicator, defined as follows (Eq. 5)54,55,56:
$${\mathrm{AICC}}\left({{\rm{n}}} \% \right)=\,\frac{{\mathrm{Count}}({\mathrm{Papers}}\in \,{\mathrm{Top}}\,{{\rm{n}}} \% \,{\mathrm{cited}}\,{\mathrm{papers}})}{{\mathrm{Total}}\,{\mathrm{Papers}}\,\times (\frac{n}{100})}$$
(5)
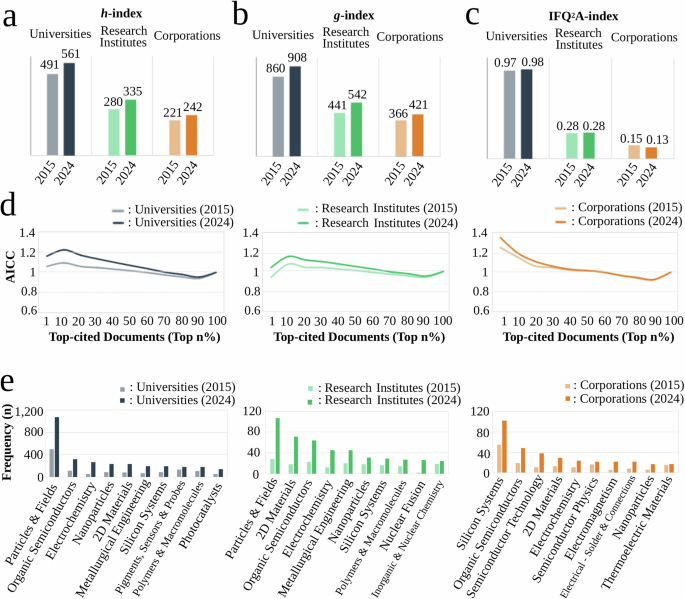
a–c Temporal comparison (2015 vs. 2024) of cumulative citation indices: a h-index, b g-index, and c IFQ2A-index. d Activity Index of Citation Classes (AICC) as a function of citation percentile, illustrating the concentration of high-impact research. e Keyword frequency analysis of the top 1% most-cited documents, highlighting the core research themes of each institutional sector.
For instance, if an institutional sector publishes 100 papers and 12 of them rank within the top 10% of citations, the AICC (10%) becomes 1.2; this indicates that the sector produced 20% more high-impact papers than expected in that specific quantile. Figure 3d illustrates the changes in AICC values for each institutional sector between 2015 and 2024, with specific numerical values by segment provided in Supplementary Table S15. Notably, AICC values for all sectors consistently exceeded the global average (1.0) within the top 1–50% range, with 2024 showing an upward shift that reflects a general improvement in qualitative impact. Specifically, corporations show a distinct concentration in the highest citation percentile (top 1%), whereas universities maintain a more distributed profile peaking at the 10% level. Meanwhile, research institutes demonstrate a steady qualitative advancement in public-sector research as of 2024.
Building upon this sectoral qualitative assessment, we further analyzed the top 1% most-cited publications (Highly Cited Papers, HCPs) via keyword frequency analysis to pinpoint the particular research areas that exerted the highest citation impact. To facilitate this keyword frequency analysis, we utilized the Citation Topics classification system of the Web of Science InCites platform; within its three-tier hierarchy (10 macro, 326 meso, and 2444 micro levels)57,58, the meso-level topics were selected as the primary units of analysis. Specifically, we manually curated a subset of these 326 topics directly related to materials science to ensure thematic relevance. Standardized guidelines for classifying these specific meso-level keywords are currently limited in the literature. Therefore, the curation was validated through a rigorous consensus review by a panel of domain experts at the Korea Institute of Materials Science (KIMS). Given the interdisciplinary nature of the field, this selection focuses on capturing macro-level trend dynamics. It is intended to provide a comprehensive overview rather than establishing an absolute taxonomy. The evaluation criteria, full topic lists, and their respective rationales are detailed in Supplementary Table S16. Figure 3e displays the top 10 meso-level keywords identified through frequency analysis of the HCPs for each sector, contrasting data from 2015 and 2024. Further details on the keywords by sector are available in Tables S17–S19. The analysis of keyword dynamics reveals distinct strategic orientations across the three institutional sectors (Supplementary Table S20). Universities exhibit a key role as the backbone of quantitative growth of HCPs, evidenced by a 137% increase (from 2525 to 5980 total counts) in the aggregate frequency of keywords within the HCPs between 2015 and 2024. This growth is largely attributed to the increase in “Particles & Fields,” which corresponds with the expansion of university-led research. Concurrently, research institutes exhibited thematic diversification across both fundamental and applied materials science, as indicated by the upward ranking of 12 existing meso-level keywords and the emergence of eight new keywords. Specifically, specialized themes such as “Nuclear Engineering,” “Nuclear Fusion,” and “Nuclear Physics” are unique to the research institute sector. This highlights its distinct role in national-scale research areas that are not prominently represented in other institutional sectors. In contrast, corporations maintain a structure highly optimized for the domestic industrial ecosystem, with research efforts heavily concentrated on “Silicon Systems” and semiconductor processes. Simultaneously, corporations are broadening their research foundation, as evidenced by the expansion into fundamental sciences (e.g., Quantum Mechanics, Physical Chemistry) and diverse application domains (e.g., Perovskite Solar Cells, Biosensors) within the top 1% citation bracket. This suggests a strategic shift toward diversifying their technical capabilities beyond traditional industrial boundaries. An analysis of the number of entities producing the HCPs by institutional sector is shown in Supplementary Table S21. Between 2015 and 2024, the share of institutions producing the HCPs increased in universities (from 59.2% to 62.8%) and corporations (from 34.0% to 37.5%). In contrast, the research institutes experienced a proportional decline from 49.2% to 42.0% during the same period, despite an increase in the absolute number of publishing institutions.
The national research landscape of the HCPs in materials science is visualized in Fig. 4 using a Sankey diagram, which maps the linkages from institutional categories to specific research themes as of 2024. The diagram specifically highlights the five leading institutions per sector and their respective involvement in the three primary domains of materials science. The diagram also captures the distributional intensity of meso-level keywords, revealing how specialized expertise is allocated within each sub-category. Among a total of 7417 HCPs in materials science, universities account for the vast majority at 81% (5,980 papers), while research institutes and corporations contribute 13% (960 papers) and 6% (477 papers), respectively, as shown in Supplementary Table S22. When classified into three major materials science frameworks, “Advanced Functional Materials & Devices” accounts for 49% (3,613 papers) of these HCPs, followed by “Fundamental Theory & Methodologies” at 38% (2792 papers) and “Structural Engineering & Processing” at 14% (1012 papers). The detailed lists and frequency counts of the underlying meso-level citation keywords within each of the three categories are provided in Supplementary Tables S23–25. While the “Advanced Functional Materials & Devices” domain accounts for the largest share of publications (49%), its research landscape is highly fragmented, resulting in a broad dispersion of individual keyword frequencies. Conversely, “Fundamental Theory & Methodologies,” despite representing a smaller portion of HCPs (38%), exhibits intense thematic concentration, particularly within the “Particles & Fields” category. “Structural Engineering & Processing” (14%) maintains a distinct focus on foundational engineering and industrial applications, specifically across sectors such as metallurgy, polymers, and wood-based materials science. Beyond the distribution of meso-level keywords, the keywords in high-impact research are primarily observed within two broad industrial domains. The first domain, “Next-generation Electronics and Semiconductors,” is characterized by keywords such as “Particles & Fields,” “Organic Semiconductors,” “2D Materials,” “Silicon Systems,” “Electrochemistry,” “Photocatalysts,” “Electromagnetism,” and “Nanoparticles.” This concentration is inferred to be closely linked to South Korea’s competitive advantage in the semiconductor and Information and Communication Technology (ICT) device industries. The second domain, the Advanced Manufacturing and Structural Materials cluster, encompasses “Metallurgical Engineering,” “Polymers & Macromolecules,” “Concrete Science,” “Power Systems & Electric Vehicles,” and “Mechanics.” This group serves as a technological baseline for major industries such as mobility, shipbuilding, and construction, directly supporting practical applications across the broader manufacturing sector.
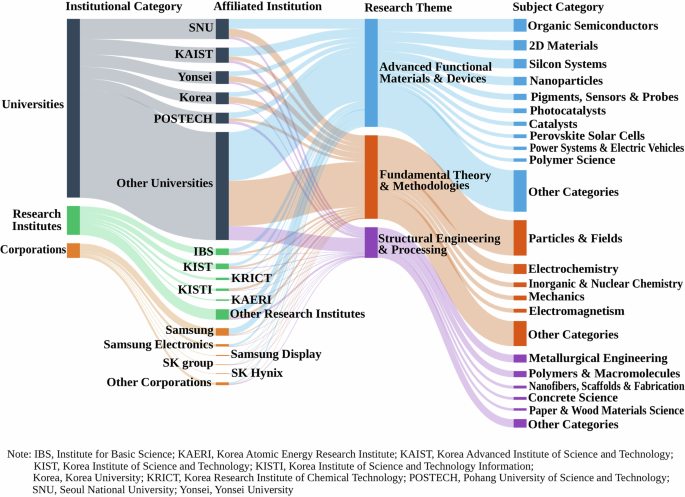
A Sankey diagram illustrating the hierarchical connectivity among institutional categories, affiliated organizations, generalized research themes, and specific subject categories as of 2024.
We further examined the human capital behind these achievements by focusing on HCPs in materials science in which South Korean researchers served as lead authors. Here, lead authors are defined as first authors and corresponding authors who take primary responsibility for the research. Specifically, we performed the analysis by leveraging a dataset of 1807 HCPs lead-authored by South Korean researchers, encompassing a total of 8961 unique contributing authors, as shown in Supplementary Table S26. Figure 5 presents the author-level analysis, showing the correlation between research productivity and the number of collaborators among the top-publishing authors. Figure 5a presents a bubble chart illustrating the relationship between the number of HCPs and cumulative count of unique collaborators for the 8961 authors. As shown in the chart, a positive correlation (R2 = 0.341) exists between the number of HCPs and scale of collaboration. This relationship indicates that researchers with broader academic networks are observed to have higher counts of HCPs. Supplementary Table S27 details the number of highly cited papers (HCPs), collaborators, main research fields, and specific research areas for the top 50 publishing authors. While focusing on the top 50 publishing authors may not fully capture the broader collaboration structure of the national research ecosystem, the primary objective of this author-level network analysis is to explore a specific subgroup. Rather than generalizing the entire national ecosystem, this analysis specifically aims to investigate the collaborative patterns and relational dynamics among the most active and central figures within this research domain.
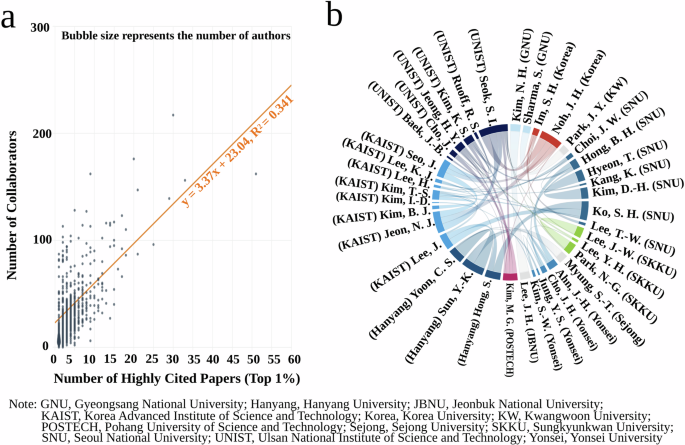
a Bubble plot illustrating the positive correlation between the number of documents and scale of collaboration (R2 = 0.341). b Chord diagram representing collaborative connections among the top-publishing authors, with ribbons indicating co-authorship links across leading institutions.
Furthermore, we acknowledge that the observed positive correlation may partly stem from an inherent relationship between research productivity and team size. As such, this pattern should be interpreted with caution, as it does not necessarily imply a direct causal link between collaboration and research excellence. The primary research areas of these top 50 publishing authors are categorized into seven major fields, as summarized in Supplementary Table S28. The distribution of research areas among these 50 publishing authors reveals a trend toward an industrial orientation, focusing primarily on specific sectors such as next-generation ICT and energy systems. Given that secondary batteries (24%), flexible and stretchable devices (20%), and solar and optoelectronics (18%) collectively account for over 60% of this group, these findings highlight a concentration of high-impact research within key sectors linked to the semiconductor and ICT industries. Figure 5b presents a chord diagram illustrating the collaborative connections among these 50 authors, while Supplementary Table S29 provides specific numerical data by detailing the frequency of mutual collaborations within this group. The primary collaborative links are concentrated among faculty from six research universities. These include the Korea Advanced Institute of Science and Technology (KAIST) (8 authors), Seoul National University (7 authors), Ulsan National Institute of Science and Technology (UNIST) (6 authors), Yonsei University (4 authors), Sungkyunkwan University (3 authors), and Hanyang University (3 authors). In particular, seven pairs of authors have published 10 or more HCPs through co-authorship, which can be categorized into two types: intra-field specialization and inter-field convergence. The first category is intra-field collaboration, which includes five pairs of researchers who deepened their domain-specific expertise to produce high-impact outcomes. These pairs include Kim & Lee (12 papers; secondary batteries), Lee & Park (11 papers; solar & optoelectronics), Noh & Seok (10 papers; solar & optoelectronics), Myung & Sun (10 papers; secondary batteries), and Hong & Ko (10 papers; flexible & stretchable devices). The second category is inter-field convergence, which involves two pairs who bridged different research areas. These include Sun & Yoon (15 papers; secondary batteries and advanced structural materials) and Hyeon & Kim (13 papers; functional nanomaterials and flexible & stretchable devices). These two patterns indicate that leading researchers in the South Korean materials science community collaborate either to deepen their expertise within a single domain or to expand it through links with different fields.
Source: www.nature.com