




Ethics approval
The pooled analysis was approved by the McGill University Faculty of Medicine and Health Sciences Research Ethics Board (institutional review board study number A12-M69-23B; 23-10-068). The study involved secondary analysis of deidentified individual-level data obtained from public repositories and through data-transfer or data-use agreements with collaborating institutions. Contributing studies obtained informed consent from participants in accordance with their own ethics approvals; as a secondary analysis of existing deidentified data, the present study involved no additional participant consent or compensation.
Data sources
We compiled individual participant data from population-based national, regional and international health studies and surveys conducted between 1990 and 2025 that assessed self-reported bodily pain (Supplementary Table 2). Data sources were identified and acquired between April 2024 and June 2026 through structured searches of bibliographic databases and public microdata repositories, review of national and international survey programs and direct contact with investigators, data custodians, cohort and biobank administrators and rheumatology networks. Publicly available datasets were downloaded directly, whereas restricted-access studies were incorporated through data-use agreements, formal data-access applications or standardized local analysis protocols when individual-level data transfer was not permitted.
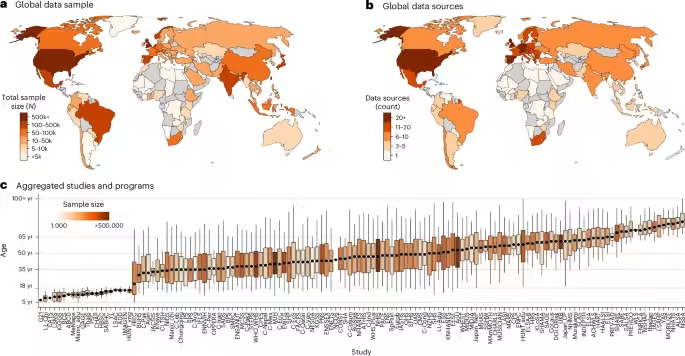
Studies were eligible if they sampled community-dwelling participants without restricting participation based on health status, assessed pain by direct participant self-report and included either (1) a pain-presence item at one or more target anatomical sites or (2) an overall or average pain-intensity rating on a 0−10 numerical rating scale (NRS) or visual analogue scale (VAS), with 0 indicating no pain. Pain was assessed by direct participant self-report, except that parent-reported pain items were accepted for young children below the age of reliable self-report in a small number of pediatric cohorts (Supplementary Information, section 2.2 and Supplementary Table 2). Studies were excluded if they relied on clinician or observational reports or other proxy reports or did not measure any target pain outcome. The final analytic dataset included 6,125,459 individuals with valid data for at least one pain outcome, drawn from 138 study programs, across 118 countries and territories (Fig. 1). Study programs comprised 902 distinct data sources, reflecting multiple survey waves or country-specific samples within multi-country studies.
Pain outcomes
The primary outcomes were binary indicators of self-reported pain at 11 anatomical sites: head, face, neck or shoulder, foot or ankle, hand or wrist, elbow, chest, back, stomach or abdomen, hip and knee. Reported pain at these anatomical sites was harmonized by mapping study-specific wording and body map coding schemes to standardized categories (Supplementary Information, section 3 and Supplementary Table 3). Where laterality was assessed, pain was coded as present if reported on either side. A composite ‘any bodily pain’ outcome was derived for studies with sufficient site coverage (Supplementary Information, section 3) and coded as present if pain was reported at any bodily site.
Secondary outcomes were as follows: (1) high-intensity pain, defined as average pain intensity of 7 or higher on a 0−10 NRS or VAS, and (2) generalized pain, defined as pain present in at least four of five body regions (left upper, right upper, left lower, right lower and axial), following the spatial criteria of the 2016 fibromyalgia revisions8. These secondary outcomes captured complementary dimensions of pain burden beyond site-specific prevalence6,7,9.
Geographic and sociodemographic features
Countries were grouped into nine world regions using a modified United Nations Sustainable Development Goals (SDGs) regional classification (Supplementary Table 4)19. National development was indexed using the HDI, obtained from United Nations Development Programme reports and matched to each participantʼs country and survey year20. Sex was self-reported within each contributing study.
Individual risk factors
We evaluated a prespecified set of three modifiable or policy-relevant exposures with established associations with pain outcomes across the literature: body mass index (BMI), smoking status and household income. These exposures were selected based on prior empirical support, alignment with GBD risk factor frameworks1 and sufficient cross-study harmonizability to support pooled estimation21,22,23. Together, they capture metabolic, behavioral and socioeconomic dimensions of pain risk. Other social and occupational determinants, including employment status, type of work, housing security and food insecurity, were not consistently available or harmonizable across the contributing datasets and require dedicated study.
Smoking status was categorized as current (regular or occasional), former or never. BMI was obtained directly from study-provided values when available or otherwise derived from measured or self-reported height and weight. Adults were classified as having normal weight (18.5−24.9 kg m−2), overweight (25.0−29.9 kg m−2) or obesity (30.0 kg m−2 or higher). For participants aged 19 years or younger, BMI categories were assigned using age-specific and sex-specific cutoffs based on pediatric growth standards from the World Health Organization24. Household income was harmonized within each study by ranking participants into study-specific income quintiles (equal-frequency groups), reflecting relative socioeconomic position within studies, consistent with established inequality monitoring practice25,26,27.
Harmonization procedure
Pain prevalence estimates vary with methodological factors such as interview setting, question phrasing, recall period and study design characteristics28,29,30. To address this, our harmonization procedure systematically evaluated seven key methodological features for their association with reported pain: recall period, case definition (general versus chronic-explicit), survey format, survey setting, question valence, question format and sampling strategy (Methods and Supplementary Information, section 6.2). Recall period showed the most consistent and substantial association with reported pain and was included in all models (short: past week; medium: past month; long: past 3−12 months). We additionally coded case definition as general versus chronic-explicit, where chronic-explicit indicated that the question specified pain lasting longer than 3 months; this covariate was included to adjust for the small subset of studies using chronic-explicit wording. The remaining five features (that is, survey format, survey setting, question valence, question format and sampling strategy) had small or site-specific effects (±2 percentage points) that did not alter age-by-site patterns and were not retained to preserve parsimony. Sensitivity analyses on the stability of global trajectories across studies (Supplementary Information, section 6.1), methodological covariates (Supplementary Information, section 6.2) and recall periods (Supplementary Information, section 6.3), random-effects structures (Supplementary Information, section 6.4), functional form (Supplementary Information, section 6.5), data missingness (Supplementary Information, section 6.6) and sampling design (Supplementary Information, section 6.7) support the robustness of our harmonization procedure.
Statistical analysis
We estimated age-specific prevalence trajectories for each pain outcome across the lifespan (ages 5 to 100 or older; ages below 5 and above 100 were bottom-coded and top-coded) using GLMMs with a logit link. Age was modeled using natural cubic splines to flexibly capture nonlinear trajectories. The spline degrees of freedom were selected using study-clustered five-fold cross-validation; 3 degrees of freedom were retained based on out-of-sample fit (Supplementary Information, section 6.5). We report 95% CIs throughout.
Primary models included an interaction between age and the exposure of interest, namely sex (Figs. 2 and 3), world region or HDI (Fig. 4) and BMI category, smoking status or income quintile (Fig. 5 and Extended Data Figs. 3–6), and were adjusted for methodological differences using fixed effects for recall period and case definition and, except for the HDI models, survey year (centered on the sample mean). Survey year was omitted from the HDI models because HDI is assigned by country year and showed limited overlap with survey year across the pooled dataset, making joint adjustment prone to extrapolation. All models additionally adjusted for sex, except those in which sex was the primary exposure. Random intercepts for study program and world region were included to account for clustering and enable partial pooling across heterogeneous data sources. In regional analyses, region was instead treated as a fixed effect with a study nested within region random intercept, preventing any single multi-country study from dominating region-specific estimates. Sensitivity analyses for missing risk factor data are reported in Supplementary Information, section 6.6.
Adjusted prevalence trajectories were obtained as marginal predictions and standardized to a past-month recall period and the general case definition and the mean survey year (Supplementary Information, section 5). HDI trajectories were plotted at four representative values (0.55, 0.70, 0.80 and 0.90) spanning low to very high development. We also quantified the rate of age-related change as the year-to-year difference in predicted prevalence (percentage-point change per year). We used these age-specific rates of change to classify trajectory shape. A site was described as showing an inverted-U pattern only when the fitted trajectory showed both an early-life increase and a later-life decline, defined by 95% CIs excluding zero for the rate of change in both phases. Relative risks and their 95% CIs were computed for all sex, exposure and HDI contrasts across pain sites and age bands, and a Benjamini−Hochberg false discovery rate correction was applied across this full family of comparisons to account for multiple testing (Supplementary Table 6). Complete numerical outputs and supporting documentation are provided in Supplementary Data 1–5, comprising relative risks, model coefficients, site-level exposure prevalences, predicted prevalence trajectories and pain question wording, respectively. All analyses were performed in R (version 4.4.1) and Python (version 3.8.13).
Ethics and inclusion statement
This study synthesized individual-level data from population-based surveys, cohort studies and national health studies conducted across multiple world regions. Data were obtained through publicly available repositories or through data-transfer and data-use agreements with collaborating researchers and institutions. The collaboration included investigators from diverse geographic regions who contributed expertise in epidemiology, clinical pain research, population health and lived experiences of pain.
Reporting summary
Further information on research design is available in the Nature Portfolio Reporting Summary linked to this article.
Source: www.nature.com