




Trial endpoints
The primary endpoint of the NHS-Galleri trial—reduction in the incidence rate of stage III/IV cancers in the intervention arm versus the control arm—was not met and is reported elsewhere26. Key secondary endpoints reported in that publication include the reduction in the incidence rate of stage IV cancers in the intervention arm versus the control arm and an evaluation of safety, including adverse events. Here we report the secondary endpoint of MCED test performance in the intervention arm and related exploratory endpoints. Other secondary endpoints, including assessing the impact of MCED test usage on healthcare resource utilization and on participant-reported psychological outcomes, comparing cancer-specific mortality between the intervention and control arms and assessing the potential impact of overdiagnosis, will be reported in future publications.
Participant characteristics
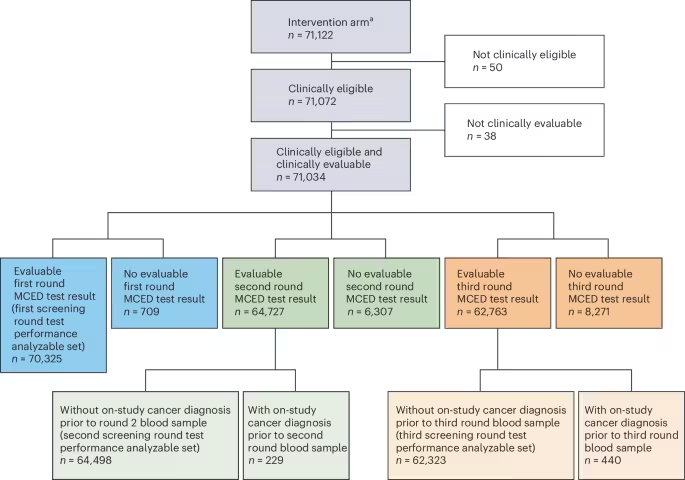
A total of 142,826 participants aged 50−77 years (at invitation; 50−78 years at enrollment) were consented over 10.5 months; 142,250 were randomized after baseline blood collection, with 71,122 assigned to the intervention arm and 71,128 assigned to the control arm (see Fig. 1 for full participant disposition). The test performance analyzable set, defined as intervention arm participants who were clinically eligible and evaluable (that is, evaluable MCED test result and successfully traced in England’s population-based cancer registry—the National Cancer Registration and Analysis Service (NCRAS)—to confirm cancer status), comprised 70,325 participants in the first round, 64,498 in the second round and 62,323 in the third round. Despite the challenges of the global COVID-19 pandemic (trial recruitment between 31 August 2021 and 16 July 2022), the trial consented participants largely reflective of the English population of that age group27 with high retention (approximately 88%) across the trial’s three annual screening rounds26.
Clinically eligible participants successfully traced in the NCRAS were included in the clinically eligible and clinically evaluable analysis set. Participants who were not successfully traced in the NCRAS were excluded from the clinically eligible and clinically evaluable analysis set. ‘Successfully traced in NCRAS’ was defined as having a confirmed cancer/non-cancer status. aOne participant aged 49 years was initially enrolled but was subsequently withdrawn for failure to meet inclusion criteria.
Demographics and baseline characteristics, by screening round, are shown in Table 1. The median age of test performance analyzable participants at enrollment was 66 years (interquartile range (IQR): 59−71), and 35,332 (50.2%) were female. Most participants were White (65,827 (93.6%)), reflecting England’s population of the relevant age group27. There was greater representation in the test performance analyzable set from the more deprived quintile of the Index of Multiple Deprivation (IMD) distribution: 22.6% (15,863) were most deprived (quintile 1), and 16.1% (11,348) were least deprived (quintile 5). Most participants reported their smoking status as never smoked (38,574 (54.9%)), and 4,680 (6.7%) reported that they currently smoke. Based on body mass index (BMI) calculated using self-reported height and weight at enrollment, 27,708 (39.4%) participants had overweight (25 to <30 kg m−2) and 19,492 (27.7%) had obesity (≥30 kg m−2). Baseline demographics of participants who returned for the second and third screening rounds were broadly similar to those of the first round analyzable set.
MCED test results, outcomes and performance
Performance metrics are presented from the prevalent (first) screening round, followed by the two incident (second and third) screening rounds. Cancer detection in the prevalent screening round is influenced by the pre-existing, undiagnosed cancers in the population for which participants may have never been previously screened28. Cancer detection in incident screening rounds is more reflective of what would be expected with a stable annual population screening program, with detected cancers having developed or become detectable in the interval since the previous screen or having been missed by the previous screen or diagnostic follow-up. Aggregate results across all three screening rounds are included in tables and figures.
The cancer signal detection rate was 1.03% (95% confidence interval (CI): 0.95−1.10%) in the first round (722/70,325 participants had a positive MCED test result; Table 2). This decreased to 0.80% (518/64,498, 95% CI: 0.74−0.87%) in the second round and to 0.90% (561/62,323, 95% CI: 0.83−0.98%) in the third round. Results for the second and third rounds excluded participants who had cancer previously diagnosed during the trial.
Among the 722 positive MCED test results in the first round, 419 (58.0%) were true-positive results with a primary cancer diagnosed during the follow-up window (Table 2), yielding a cancer detection rate of 0.60% (419/70,325, 95% CI: 0.54−0.66%) and a corresponding number needed to screen to detect one primary cancer of 168 (95% CI: 153−185). In the second and third rounds, the cancer detection rates were lower at 0.40% (261/64,498, 95% CI: 0.36−0.46%) and 0.41% (257/62,323, 95% CI: 0.37−0.47%), corresponding to numbers needed to screen of 247 (95% CI: 219−279) and 243 (95% CI: 215−274), respectively.
PPV was 58.0% (95% CI: 54.4−61.6%) in the first round when calculated based on primary cancers only (See ‘Exploratory analyses’ section below for metrics including recurrent cancers). PPV was 50.4% (95% CI: 46.1−54.7%) in the second round and 45.8% (95% CI: 41.7−49.9%) in the third round. For each of the three rounds, specificity was 99.56% (95% CI: 99.51−99.61%), 99.60% (95% CI: 99.54−99.64%) and 99.50% (95% CI: 99.45−99.56%), corresponding to a false-positive rate of 0.44% (95% CI: 0.39−0.49%), 0.40% (95% CI: 0.36−0.46%) and 0.50% (95% CI: 0.44−0.55%), respectively. Negative predictive value (NPV) was 98.98% (95% CI: 98.91−99.05%) in the first round, 98.90% (95% CI: 98.82−98.98%) in the second round and 98.86% (95% CI: 98.77−98.94%) in the third round (Table 2).
Episode sensitivity, defined as the proportion of participants diagnosed with a primary cancer within the prespecified follow-up window (within 12 months of the corresponding blood collection) who had a positive MCED test result for that screening episode, was 37.2% (95% CI: 34.4−40.0%) in the first round, 27.1% (95% CI: 24.4−30.0%) in the second round and 26.7% (95% CI: 24.0−29.6%) in the third round (Table 2). Episode sensitivity was also calculated for a subgroup of 12 prespecified cancer types responsible for more than 60% of cancer deaths14,25 (anus, bladder, colon/rectum, esophagus, head and neck, liver/bile duct, lung, lymphoma, ovary, pancreas, plasma cell neoplasm (myeloma) and stomach). For this subgroup, episode sensitivity was 63.4% (95% CI: 58.9−67.7%), 47.6% (95% CI: 42.5−52.8%) and 50.7% (95% CI: 45.6−55.7%) in the first, second and third rounds, respectively (Supplementary Table 1). Across all individual cancer types, aggregate episode sensitivity for the three rounds ranged from 88.9% (32/36, 95% CI: 74.7−95.6%) for liver/bile duct cancers to 2.5% (4/157, 95% CI: 1.0−6.4%) for melanoma (Supplementary Table 1 and Supplementary Fig. 1).
Exploratory prespecified subgroup analyses by age, sex, smoking status, prior cancer history, race/ethnicity, IMD quintile and education were conducted (Fig. 2 and Supplementary Tables 2–8). The aggregate cancer detection rate increased with age (at enrollment) from 0.18% (95% CI: 0.14−0.22%) for participants aged 50−59 years to 0.78% (95% CI: 0.71−0.85%) in those aged 70−79 years; the age-specific aggregate false-positive rate also increased with age from 0.18% (95% CI: 0.15−0.22%) to 0.76% (95% CI: 0.70−0.83%) (Fig. 2 and Supplementary Table 2). Compared to female participants, male participants had a higher aggregate cancer detection rate (0.58% (95% CI: 0.53−0.63%) versus 0.38% (95% CI: 0.34−0.42%)) and a higher aggregate false-positive rate (0.55% (95% CI: 0.50−0.60%) versus 0.35% (95% CI: 0.31−0.38%)) (Fig. 2 and Supplementary Table 3). Thus, the PPV was relatively homogeneous across age groups and sex. Aggregate cancer detection rate and episode sensitivity were higher for participants who currently smoke than for those who never smoked, although imbalance in the subgroup sizes should be noted (Fig. 2 and Supplementary Table 4). Aggregate PPV was lower and false-positive rate was higher for participants with prior cancer history compared to those without prior cancers, but these metrics were calculated based on primary cancers, and differences were reduced when MCED-detected recurrent cancers were included as true positives (see ‘Exploratory analyses’ section; Fig. 2 and Supplementary Table 5).
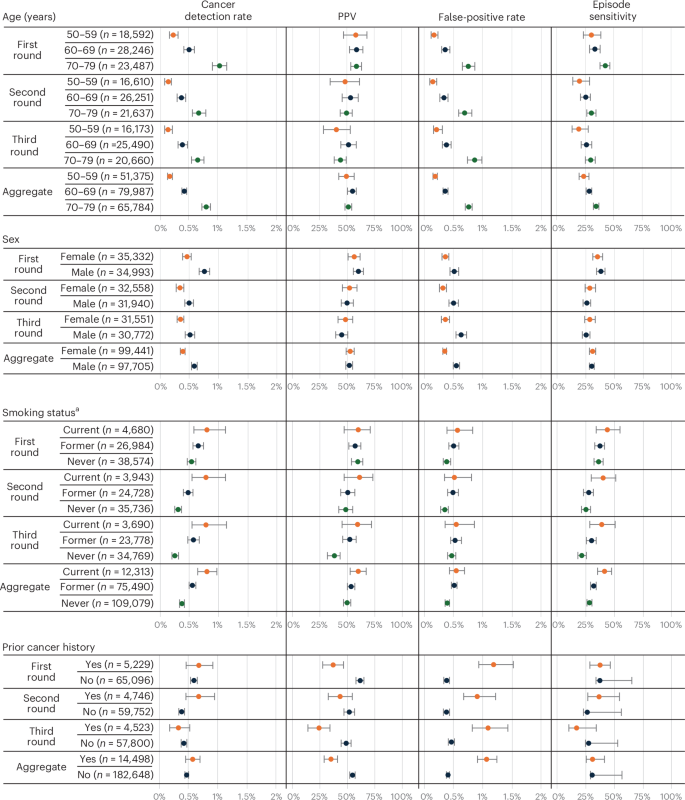
Performance metric data are presented as observed percentages for each subgroup; error bars denote two-sided 95% CIs. Performance metric estimates were calculated as defined in Supplementary Table 15 based on MCED test results and new cancer diagnoses received within the follow-up period for that round. The n/N used to calculate the estimates can be found in Supplementary Table 2 for Subgroup: Age; in Supplementary Table 3 for Subgroup: Sex; in Supplementary Table 4 for Subgroup: Smoking Status; and in Supplementary Table 5 for Subgroup: Prior Cancer History. Subgroup categories (shown on the y axis) are based on participant characteristics at the time of enrollment. aParticipants with missing smoking category are not included in calculations (87 participants in round 1, 91 participants in round 2 and 86 participants in round 3).
Predicted CSOs are returned with positive MCED test results to guide diagnosis by providing the anatomical site or cellular lineage most likely to be the source of the detected cancer signal. In the first round, a correct first or second CSO (CSO1/CSO2) prediction was returned for 93.6% (392/419, 95% CI: 90.8−95.5%) of participants with true-positive test results. CSO1/CSO2 prediction accuracy was consistent across rounds: 92.3% (241/261, 95% CI: 88.5−95.0%) in the second round and 91.1% (234/257, 95% CI: 86.9−94.0%) in the third round (Fig. 3 and Table 3). In aggregate across the three screening rounds, the accuracy for CSO1 was 87.0% (815/937, 95% CI: 84.7−89.0%); the accuracy for CSO2 prediction was 46.8% (52/111, 95% CI: 37.8−56.1%) for true-positive test results with two CSOs returned when CSO1 was inaccurate. CSO performance was also consistent by sex across rounds (Supplementary Fig. 2).
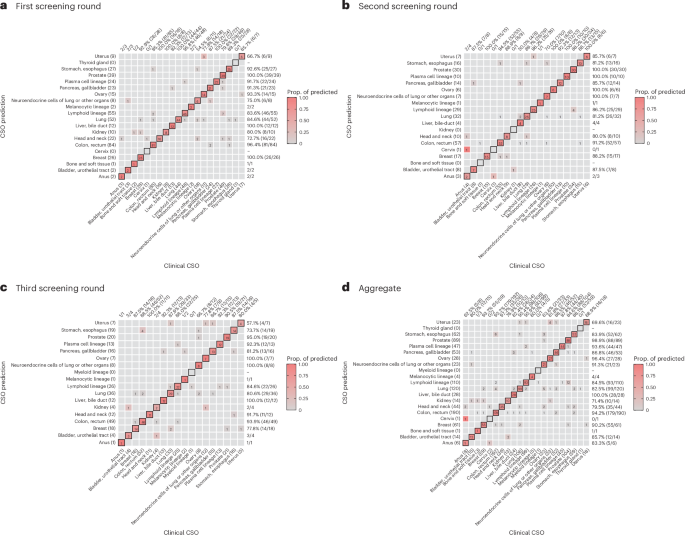
a, First screening round. b, Second screening round. c, Third screening round. d, Aggregate. The confusion matrix for each round and in aggregate plots the number of participants for each combination of CSO prediction (y axis) and clinical CSO (x axis). Participants diagnosed with cancer types without CSOs and unassigned clinical CSO (NCRAS CUP) are not visualized. Participants with multiple primary cancers are included in the confusion matrix if one cancer has an assigned clinical CSO. Diagonal cells indicate correct CSO1 assignments (accuracy), and off-diagonal cells indicate misclassifications (errors). CSO1 prediction accuracy by clinical CSO (estimated by the proportion of the diagonal cell in each column) is indicated at the top of the matrix, and precision of each CSO prediction (estimated by the proportion of the diagonal cell in each row) is indicated along the right side. Accuracy and precision are not estimated for subgroups with fewer than five cases. The color is associated with the proportions of matched predicted and clinical CSOs. Only CSOs with at least one prediction or diagnosed cancer are included in each matrix. CUP, cancer of unknown primary; Prop, proportion.
PPV stratified by CSO prediction varied across CSO predictions and by round (Supplementary Fig. 3 and Supplementary Table 9). This was typically a result of small numbers of some CSO predictions leading to unstable point estimates and wide CIs. In aggregate across all three screening rounds, the highest PPVs were generally observed for CSOs corresponding to the subgroup of 12 prespecified cancer types, including ovary (93.3%), stomach/esophagus (64.6%), pancreas/gallbladder (64.3%) and liver/bile duct (63.8%); neuroendocrine also had very high PPV (82.8%). The lowest PPV was for bone and soft tissue, which was based on just five samples with that CSO and one actual diagnosis (20.0%, 95% CI: 3.6−62.4%) (Supplementary Fig. 3 and Supplementary Table 9).
Diagnosed cancer stage and type
Among the 419 participants with MCED-detected cancers in the first round, most were diagnosed prior to stage IV disease: stage I−II, 166 (39.6%); stage I−III, 289 (69.0%) (with 27 (6.4%) being either unstageable or having missing stage) (Supplementary Table 10). There were 261 participants with MCED-detected cancers in the second round, with 105 (40.2%) being diagnosed with stage I−II cancers and 180 (69.0%) being diagnosed with stage I−III cancers. Among the 257 participants with MCED-detected cancers in the third round, 95 (37.0%) were diagnosed with stage I−II cancers and 171 (66.5%) with stage I−III cancers. In aggregate, 366 of 937 (39.1%) of MCED-detected cancers were diagnosed at stage I−II and 640 of 937 (68.3%) at stage I−III.
In total, of the 937 participants with at least one MCED-detected cancer, 646 (68.9%) were of the 12 prespecified cancer types. The most common MCED-detected cancer types were colon/rectum (186 (19.9%)), lung (127 (13.6%)), prostate (103 (11.0%)), lymphoma (71 (7.6%)), breast (56 (6.0%)), plasma cell neoplasm (43 (4.6%)), esophagus (42 (4.5%)), pancreas (36 (3.8%)), ovary (34 (3.6%)), liver/bile duct (32 (3.4%)) and head and neck (32 (3.4%)) (Supplementary Table 1, in which anyone with more than one cancer diagnosis was classified as ‘multiple cancers’). The proportion of true-positive MCED test results attributable to lung cancer increased slightly across rounds, from 11.7% (49/419) in the first round to 13.8% (36/261) in the second round and to 16.3% (42/257) in the third round, despite broadly stable absolute numbers. A prespecified descriptive summary of the 937 first primary cancers detected by the MCED test across all three rounds (Supplementary Table 10, in which anyone with more than one cancer diagnosis was classified according to their first diagnosis) showed that most were types that do not have recommended screening programs in the UK, with 682 of 937 (72.8%) MCED-detected cancers excluding breast, cervix and colon/rectum and 550 of 937 (58.7%) excluding breast, cervix, colon/rectum and lung. In a post hoc analysis based on American Joint Committee on Cancer (AJCC) classifications29, 41 unique cancer types were diagnosed after a positive MCED test result (Supplementary Table 11).
Among the 708 participants with false-negative test results in the first round, 478 of 708 (67.5%) had stage I−II disease diagnosed within 12 months of testing (Supplementary Table 12). Similarly, most participants with false-negative test results in the second and third rounds were eventually diagnosed with stage I−II disease (462/702 (65.8%) and 473/704 (67.2%), respectively). Among all 2,114 participants with false-negative test results across all three rounds, the most common types of cancers with which they were diagnosed were prostate (713 (33.7%)), breast (301 (14.2%)), melanoma (153 (7.2%)), colon/rectum (130 (6.1%)) and lung (126 (6.0%)) (Supplementary Fig. 4 and Supplementary Table 1).
Exploratory analyses
A caveat with the PPV analysis in this study is that the NCRAS registers only primary cancers, such that positive MCED test results for those diagnosed with recurrent cancers were classified as false positive. Although only 7.4% of participants had a prior cancer history, a sensitivity analysis for PPV was conducted that included recurrent cancers in those with a positive MCED test result. Of participants with false-positive test results when considering only primary cancers, 5.6% (17/303) were determined to have recurrent cancers in the first round, 2.7% (7/257) in the second round and 3.9% (12/304) in the third round. After reclassifying adjudicated recurrences from false positive to true positive (Methods), PPV increased from 58.0% (419/722) to 60.4% (436/722) in the first round, from 50.4% (261/518) to 51.7% (268/518) in the second round and from 45.8% (257/561) to 48.0% (269/561) in the third round (Supplementary Table 13). The aggregate PPV in participants with a prior cancer history rose from 34.9 (95% CI: 29.1−41.2%) to 50.4% (95% CI: 44.0−56.8%) with the inclusion of recurrences, which is similar to the PPV in participants without prior cancer history (54.6% (95% CI: 52.1−57.0%)) (Supplementary Tables 5 and 13).
In a post hoc analysis of participants with results classified as false positive in the first round, 17.8% (54/303) were subsequently diagnosed with cancer during the second or third round follow-up windows, including 36 cases in the second round and 18 cases in the third round (Supplementary Table 14). Of these, 81.5% (44/54) had cancers concordant with the first round CSO1/CSO2 prediction and 75.9% (41/54) with the CSO1 prediction, meaning that only 3.3% of the participants with false-positive test results (10/303) were later diagnosed with a cancer discordant with the original CSO prediction. Similar patterns were observed for participants with false-positive test results in the second round: 9.7% (25/257) of participants who received false-positive results in the second round were diagnosed with cancer in the third round, and 72.0% (18/25) of these participants had received a correct CSO1/CSO2 prediction (Supplementary Table 14).
Source: www.nature.com