




Baseline characteristics of DBPs in drinking water
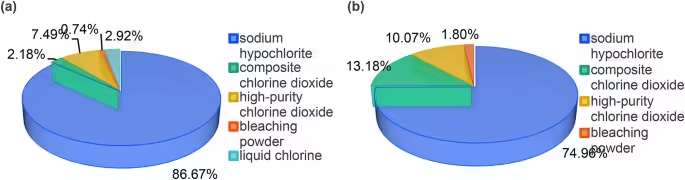
A total of 3931 conventionally treated drinking water samples were collected across the study area, including 2709 surface water samples and 1222 groundwater samples. Five disinfection methods were applied for surface water, namely sodium hypochlorite, composite chlorine dioxide (prepared from chlorate), high-purity chlorine dioxide (prepared from chlorite), bleaching powder and liquid chlorine. For groundwater, four disinfection methods were adopted, including sodium hypochlorite, composite chlorine dioxide (prepared from chlorate), high-purity chlorine dioxide (prepared from chlorite), and bleaching powder. Sodium hypochlorite disinfection was the predominant approach in both surface water and groundwater sources (Fig. 1).
Application of disinfection methods in conventionally treated drinking water. (a) Proportion of disinfection methods for surface water; (b) Proportion of disinfection methods for groundwater.
It can be seen from Table 2 that the detection frequencies of the six DBPs in water samples ranged from 30.25% to 60.44%. TCM exhibited the highest detection frequency (60.44%), while DCAA showed the lowest (30.25%). DCAA had the highest median concentration (6.00 µg/L), and TCAA the lowest (2.20 µg/L). The detection frequencies of trihalomethanes were higher than those of haloacetic acids, whereas concentration levels varied between the two categories.
In terms of hydrological periods, the concentrations of TCM, DBCM and TBM in the wet season were significantly higher than those in the dry season (P2 < 0.05), whereas DCAA concentrations were higher in the dry season (P2 < 0.001). With respect to water sources, surface water contained significantly higher concentrations of TCM, BDCM and DBCM than groundwater (P2 < 0.001); no statistically significant intergroup differences were observed for DCAA and TCAA (P2 > 0.05). For urban-rural comparisons, concentrations of BDCM, DBCM, TBM, DCAA and TCAA were higher in rural areas than in urban areas (P2 < 0.001), while no significant urban-rural difference was found for TCM. Significant differences in the concentrations of all six DBPs were detected across different disinfection methods (P2 < 0.05). Specifically, samples treated with liquid chlorine generally presented elevated DBPs concentrations, whereas lower concentrations were observed in the bleaching powder group. Collectively, these results indicate that water source type, seasonal variation, urban-rural location and disinfection practice are associated with DBPs exposure levels (Table 3).
Comparison of DBPs concentrations under different disinfection methods
Concentrations of disinfection by-products varied markedly among different disinfection strategies. As shown in Fig. 2, only low-level TCAA (2.20 µg/L) was detected under high-purity chlorine dioxide disinfection, while most other target DBPs were non-detectable, indicating its low DBP-formation potential. In comparison, liquid chlorine disinfection produced remarkably high concentrations of DCAA (25.00 µg/L) and TCAA (50.00 µg/L), whereas TBM was not detected. The TCAA concentration in the liquid-chlorine group was more than 10-fold higher than those of other disinfection groups, and DCAA reached approximately 5–7 times the concentration observed in other groups.
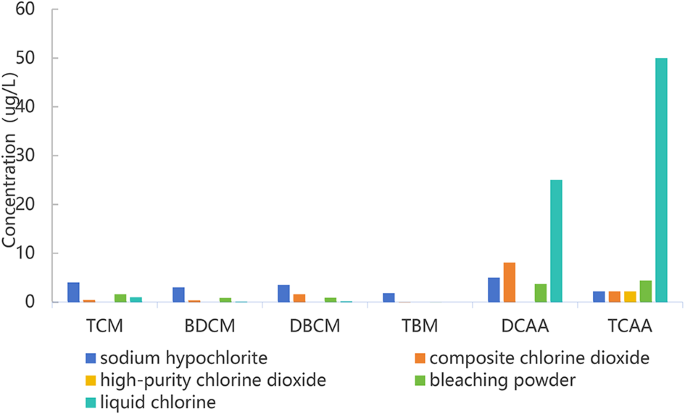
Concentration distribution of six DBPs under different disinfection methods.“—” indicates that the target analyte was not detected. Extremely high concentrations of DCAA and TCAA were observed under liquid chlorine disinfection, which visually compresses the height of bars for low-concentration groups.
Combined effects of different disinfection methods and water source
Water sample type and disinfection method are key factors influencing DBPs formation, which are of great significance for mechanism research and public health management. This study adopted a GLM with a log-link function to investigate the combined effects of disinfection methods and water source types on DBPs generation. The most commonly used combination of sodium hypochlorite and surface water (largest sample size) was set as the reference group. Since liquid chlorine was only used for surface water and no groundwater samples were available, its interaction with water sources was excluded to avoid matrix singularity, and liquid chlorine was analyzed independently. Interaction analysis was conducted for the other four disinfectants and water sources.
As presented in Table 3, the interaction between disinfection method and water source exerted significant impacts on the formation of various DBPs.
For THMs: In surface water, high-purity chlorine dioxide and bleaching powder strongly inhibited TCM production, and liquid chlorine also exerted a slight inhibitory effect. In groundwater, sodium hypochlorite and composite chlorine dioxide effectively suppressed TCM, while high-purity chlorine dioxide and bleaching powder increased TCM risks. For BDCM, high-purity chlorine dioxide inhibited its formation in surface water, whereas liquid chlorine promoted its accumulation; sodium hypochlorite reduced BDCM levels in groundwater. Relative to sodium hypochlorite, high-purity chlorine dioxide, composite chlorine dioxide, bleaching powder and liquid chlorine all inhibited DBCM in surface water. By contrast, high-purity and composite chlorine dioxide facilitated DBCM formation in groundwater. All disinfectants restrained TCM formation in surface water, with high-purity chlorine dioxide being the most effective. Sodium hypochlorite reduced TBM risks in groundwater, while high-purity chlorine dioxide increased TBM production in groundwater.
For HAAs: Liquid chlorine greatly boosted DCAA and TCAA formation in surface water, while high-purity chlorine dioxide and bleaching powder inhibited DCAA in surface water. High-purity chlorine dioxide suppressed TCAA in both surface water and groundwater, and sodium hypochlorite also lowered TCAA concentrations in groundwater (Table 4).
By examining the interaction effect plot of disinfection method combined with water source type on DBPs concentrations Fig. 3, it can be found that DBPs concentrations varied greatly with different disinfection methods under the two water source types, indicating a strong interaction effect between disinfection method and water source type. For both water source types, high-purity chlorine dioxide showed the best inhibitory effect on THMs, significantly reducing their concentrations to the lowest levels among all disinfection methods; however, its inhibitory effects on DCAA and TCAA were not significant. When liquid chlorine was applied to surface water, the concentrations of DCAA and TCAA increased sharply, leading to a significant rise in associated risks. In groundwater, by contrast, the concentrations of these two DBPs remained at low levels with higher safety. Bleaching powder and composite chlorine dioxide resulted in smaller fluctuations in DBPs concentrations in surface water scenarios (Fig. 3).The data underlying Figs. 3 and 4 are listed in Table S2 and Table S3 of the Supplementary Information.
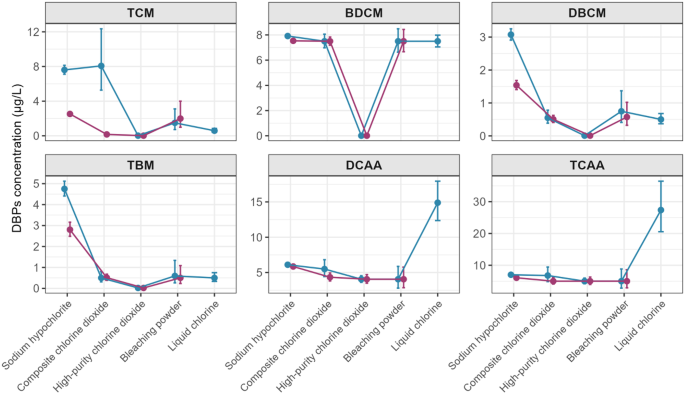
Median concentration patterns of six disinfection DBPs under the interaction of different disinfection processes and water source types. Blue represents surface water, and red represents groundwater. The differences in the trend of the lines directly reflect the strength of their interaction.
As shown in Fig. 4, most DBPs in surface water had higher median values, greater data dispersion and more extreme outliers than those in groundwater, suggesting a higher DBP formation risk in surface water. Samples treated with sodium hypochlorite contained numerous high-concentration outliers, especially in surface water. Since liquid chlorine was only used for surface water, cross-source comparison was unavailable, yet DCAA and TCAA concentrations under liquid chlorine disinfection were markedly higher than other DBPs. For composite chlorine dioxide, surface water had higher DCAA, TCAA and TCM levels than groundwater, while BDCM, DBCM and TBM showed similar concentrations in the two water sources. High-purity chlorine dioxide produced highly concentrated, low DBP values with few outliers in both water types, exhibiting the most stable control performance.
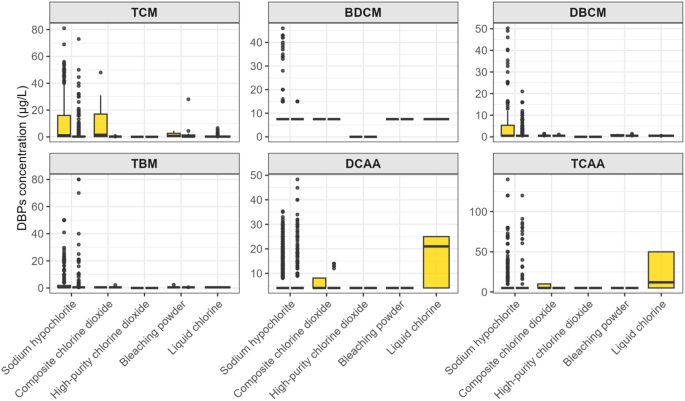
Box plots of the concentration distribution of six DBPs under different combinations of disinfection methods and water sources. Blue represents groundwater, and yellow represents surface water. The boxes represent the interquartile range of the data, and the scattered points represent samples with abnormally high concentrations.
Sensitivity analysis
Sensitivity analysis was conducted to verify the robustness of interaction estimates by substituting concentrations below the LOD with the LOD value, and outcomes were compared with the primary analysis using half-LOD substitution. The magnitude and direction of interaction effects between disinfection method and water source classification remained consistent across the two schemes. No reversal of effect trends was observed, and the statistical significance of interaction terms exhibited no fundamental changes. Such evidence indicated that different substitution strategies for non-detect DBP concentrations exerted limited influence on analytical outputs, demonstrating that the core findings of the GLM interaction analysis were reliable and stable (Table S4).
Health risk assessment of individual DBPs
To quantify the degree of harm caused by DBPs to human health, health risk assessments, including R and HI, were conducted for each of the six DBPs. The results are shown in Figs. 5 and 6.
Carcinogenic risk assessment
Figures 5 and 7 show that infants aged 0–3 years had the highest single DBPs carcinogenic risk among minors. Risk declined gradually with age and body weight due to reduced per-unit-weight exposure dose, with steady decreases seen in 6–18 years old adolescents.
TCM and TBM had R < 1.0 × 10⁻⁶ for all age groups, signifying no carcinogenic threat per US EPA guidelines. DBCM posed potential carcinogenic risk (1.0 × 10⁻⁶ ≤ R ≤ 1.0 × 10⁻⁴) for 2–3 years old and adults over 18, while its risk stayed acceptable in other age brackets. BDCM, DCAA and TCAA fell within 1.0 × 10⁻⁶ to 1.0 × 10⁻⁴ across all ages and genders, requiring enhanced monitoring for their controllable potential carcinogenic risk.
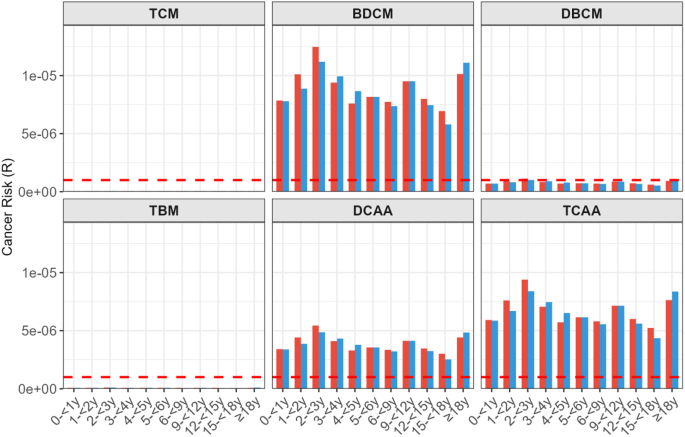
Distribution of individual carcinogenic risks of six DBPs across age and gender groups. Red stands for females and blue for males. Column height differences reflect age-stratified carcinogenic risk variations. The red dashed line marks the 1.0 × 10⁻⁶ threshold; values above this line indicate potential carcinogenic risk.
Non-carcinogenic risk assessment
As shown in Figs. 6 and 7, 0-3years old infants had the highest individual non-carcinogenic DBPs risks among children. BDCM, DCAA and TCAA exhibited far higher HI values than the other three DBPs and should be prioritized in drinking water health control. The HI of all six DBPs remained below 1 in every age group, meaning no chronic non-carcinogenic toxic risks and acceptable exposure levels.
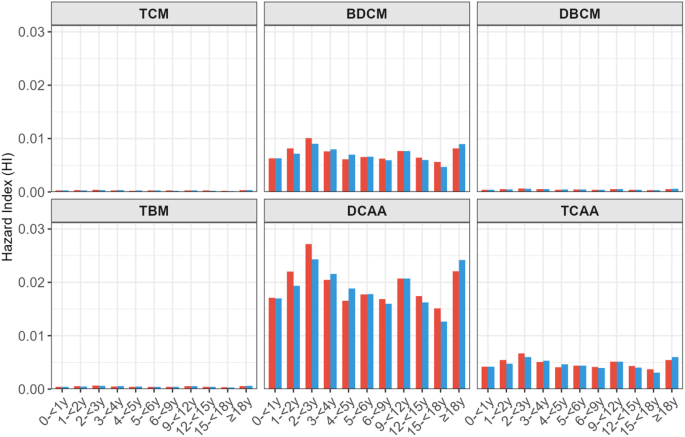
Distribution of individual non-carcinogenic risks of six DBPs across age and gender groups. Red denotes females and blue denotes males. Column height variations reveal age-stratified disparities in non-carcinogenic risks of different DBPs.
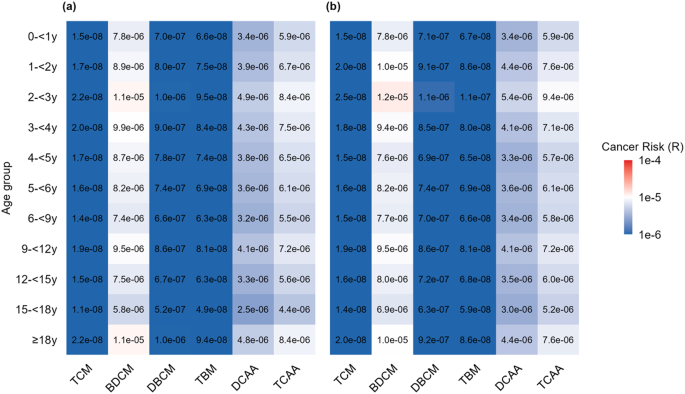
Heatmap of individual DBPs carcinogenic risks stratified by gender and age. Blue represents acceptable risk, white the 1.0 × 10⁻⁶ critical threshold, and red potential carcinogenic risk. Color gradients visualize disparities in carcinogenic exposure across pollutants, age groups and genders.Panel a corresponds to males, and panel b corresponds to females.
Health risk assessment of mixed DBPs
Total carcinogenic risk
As shown in Fig. 8(a), infants aged 0–3 years bore the highest combined carcinogenic risk of DBPs among all age brackets. Risk fell with rising age and body weight due to reduced exposure dose per unit mass, declining continuously for adolescents aged 6–18. Across all ages, total carcinogenic risk for both genders ranged 1.0 × 10⁻⁶ to 1.0 × 10⁻⁴. Per US EPA standards, all populations faced potential carcinogenic hazards requiring targeted control. Females generally had higher risk than males of equal age, with the gap most obvious in adults.
Total non-carcinogenic risk
Figure 8(b) reveals a non-carcinogenic risk trend matching that of carcinogenic risk. The total HI peaked in 0–3-year-old infants, dropped to a steady low level in teenagers, and rebounded slightly in adults over 18 from long-term cumulative exposure. The total HI of all 22 subgroups was well below the safety limit of 1. Long-term non-carcinogenic risks from DBP intake were acceptable under US EPA criteria, with negligible chronic toxic harm to human health.

Comprehensive health risks of six DBPs across age and gender groups. Red denotes females and blue denotes males. The upper and lower subplots separately depict total carcinogenic risk and non-carcinogenic hazard index. Column variations reveal age and gender differences in lifelong DBP exposure risks. The red dashed line represents the 1.0 × 10− 6 threshold, above which poses potential carcinogenic risks.
Source: www.nature.com