





Nu’s forward P/E sits at 13.7 versus Robinhood’s 38.3, yet the cheaper stock carries a different set of risks worth weighing.
By Erin Kennedy – Updated
Key Points
Robinhood Markets is expanding its retail platform with new asset classes like event contracts and institutional-grade cryptocurrency services.
Nu is experiencing explosive growth as it scales its digital banking operations to over 140 million customers in Latin America.
Which of these high-growth financial disruptors is the better fit for your portfolio through 2027?
As digital transformation continues to sweep through the global financial landscape, investors are comparing Robinhood Markets (HOOD -9.44%) and Nu (NU -4.65%) to see which stock offers the best growth potential through 2027.
Robinhood disrupted the domestic brokerage industry by democratizing access to trading and cryptocurrency for millions of users. Nu is a dominant digital bank in Latin America, providing low-cost financial services to a massive, underserved population. Both companies represent a shift away from traditional banking toward mobile-first, technology-driven financial ecosystems.
The case for Robinhood Markets
Robinhood provides a multifaceted platform for retail investors, offering stocks, Bitcoin (BTC -7.68%), and digital banking services. It recently expanded into institutional-grade services and introduced a credit card to deepen its relationship with users. According to its latest annual report, the company relies on partners like Amazon (AMZN -4.10%) for cloud infrastructure and Morningstar (MORN -0.30%) for research data.
In the 12 months ended Sept. 30, 2026, revenue reached nearly $5.1 billion, an increase of roughly 21.1%. The company reported net income of approximately $2 billion during this time frame. This performance reflects a significant stabilization in its business model compared to previous years when trading volumes were more volatile.
As of Robinhood’s December 2025 balance sheet, the debt-to-equity ratio was about 1.3. This ratio measures how much debt a company uses relative to the value owned by shareholders. In the fiscal year ended Dec. 31, 2025, free cash flow was close to $1.6 billion. Free cash flow is the cash left over after a company pays for its operations and capital expenditures.
The case for Nu
Nu operates as a digital-first bank, providing credit cards, personal loans, and savings accounts to millions of customers. It focuses on underbanked populations in Brazil, Mexico, and Colombia, using lower overhead costs to offer better rates than traditional incumbents. The company’s rapid expansion has made it one of the largest financial institutions in its region.
In the 12 months ended June 30, 2026, revenue reached nearly $19.4 billion, an increase of approximately 53.2%. Net income for the period was roughly $3.6 billion. This growth highlights the scale of the digital banking shift occurring across emerging markets as users move away from physical branch locations.
As of Nu’s December 2025 balance sheet, the debt-to-equity ratio was about 0.5, and the current ratio was roughly 0.6. In the fiscal year ended Dec. 31, 2025, free cash flow was close to $3.5 billion, providing capital to fund further international expansion.
HOOD & NU: Performance Comparison
HOOD – Robinhood Markets
$62.17
–9.44% (–$6.48)

NU – Nu Holdings
$11.27
–4.65% (–$0.55)
Key Financial Metrics

HOOD – Robinhood Markets
$62.17
–9.44% (–$6.48)
NU – Nu Holdings
$11.27
–4.65% (–$0.55)
Market Cap
$62B
52wk Range
$61.75 – $139.75
Gross Margin
94.81%
P/E Ratio
31.69
EPS (TTM)
$2.17
Market Cap
$57B
52wk Range
$11.20 – $18.98
P/E Ratio
14.64
EPS (TTM)
$0.80
HOOD – Robinhood Markets
$62.17
–9.44% (–$6.48)
Market Cap
$62B
52wk Range
$61.75 – $139.75
Gross Margin
94.81%
P/E Ratio
31.69
EPS (TTM)
$2.17
NU – Nu Holdings
$11.27
–4.65% (–$0.55)
Market Cap
$57B
52wk Range
$11.20 – $18.98
P/E Ratio
14.64
EPS (TTM)
$0.80
Risk profile comparison
Robinhood Markets faces significant regulatory and legal uncertainty regarding its payment for order flow practices and the classification of its event contracts. These legal challenges, which include scrutiny from state gaming regulators, could impact its future revenue streams. Additionally, the company is highly dependent on third parties like Amazon for its underlying cloud technology infrastructure.
Nu faces risks associated with operating in emerging markets, where economic volatility and currency fluctuations can impact its reported results. The company must also manage credit risks as it expands its lending products to a broader customer base during different economic cycles. Since it operates as a bank, it is subject to rigorous capital requirements and oversight by various international financial regulators.
Valuation comparison
While Nu offers a significantly lower forward P/E multiple, Robinhood carries a higher premium that reflects its diverse expansion into different financial services and trading asset classes.
| Metric | Robinhood Markets | Nu |
|---|---|---|
| Forward P/E | 38.3 | 13.7 |
| P/B ratio | 7.1 | 5.1 |
Valuation metrics include sourcing from Financial Modeling Prep (FMP) and may differ from other data providers.
The P/B ratio compares the stock price with the company’s book value, which represents its assets minus its liabilities. Investors frequently use this metric to evaluate bank stocks. A lower P/B ratio indicates that a stock is less expensive relative to its paper value.
Which stock would I buy for 2027?
Neither of these stocks is something I’d normally invest in, because I’m a pretty conservative investor. Nu does not appeal to me given my past negative experiences with emerging market stocks (once bitten, twice shy). I don’t find Robinhood attractive because at a previous publication I worked at, we rated brokerages. Robinhood was consistently low-scoring, and users were not shy about saying so. In particular, respondents reported that it has poor customer service. Contrast that with a competitor like Schwab (SCHW -2.13%), which has online chat (with real people), a phone line, and even physical branches. And while Robinhood may have pioneered commission-free trading, that’s table stakes now.
Both of these companies went public in 2021. Let’s see how their stocks have performed since:
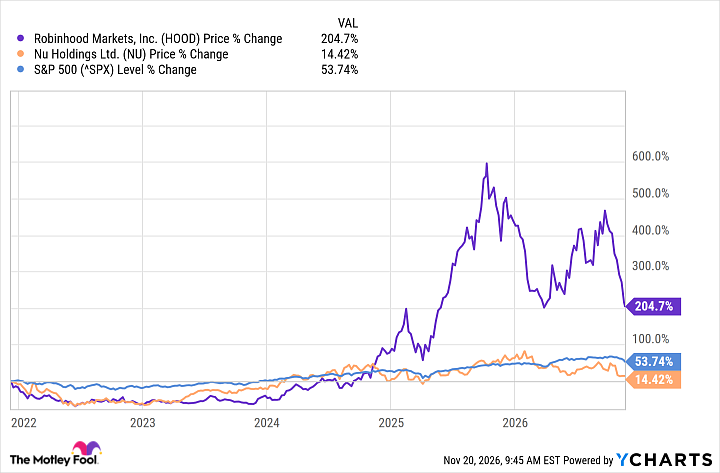
Nu does not compare favorably here; its stock hasn’t even kept pace with inflation. Robinhood has delivered a strong performance, but it’s seen a fair amount of volatility along the way. Of course, past performance is no indication of future results. But if I had to choose between these two, my vote would be for Robinhood.
Where to invest $1,000 right now
When our analyst team has a stock tip, it can pay to listen. After all, Stock Advisor’s total average return is 768%* — a market-crushing outperformance compared to 199% for the S&P 500.
They just revealed what they believe are the 10 best stocks for investors to buy right now, available when you join Stock Advisor.
*Stock Advisor returns as of November 20, 2026.
Source: www.fool.com